A Comparison of Permeability Prediction Methods Using Core Analysis Data
A Comparison of Permeability Prediction Methods Using Core Analysis Data
Permeability is one of the most important parameters of reservoir rocks, it illustrates the capacity of a rock to transmit fluids (oil, gas, water) in pore spaces. Permeability data can be obtained from routine core analysis in the laboratory on 1.5 in plugs and sidewall core. However, coring is limited due to the cost issue, so permeability prediction in uncored sections play a significantly important role. The variety of methods developed to estimate permeability using pore-scale such as Kozeny-Carman, Swanson, and Pittman. In fact, those equations are applied individually to estimate permeability. In this research, permeability estimation methods will be used on the same rock (sandstone or carbonate rock) to detect the suitable method for each rock type.
Porosity, permeability data from routine core analysis and pore throat size from mercury injection capillary pressure on sandstone and carbonate rocks from Cuu Long and Song Hong basins in Vietnam will be gathered and permeability estimation conducted by using Hydraulic Flow Unit (HFU), Mercury Injection Capillary Pressure (MICP) and Pittman methods based on that data. Estimated permeability obtained from each method will be compared with core permeability, the method with the highest R-squared be selected.
The research shows that Hydraulic Flow Unit is the most suitable methods for permeability prediction on sandstone with R-squared > 0.9. On the other hand, mercury injection capillary pressure is the most accurate method to estimate permeability on carbonate rocks related to heterogeneity and complicated pore system. That results will help engineers have a fast and accurate decision for permeability prediction methods selection on sandstone and carbonate rocks.
In addition, the empirical equations were derived to predict permeability on sandstone and carbonate rocks with the highest coefficient of correlation in multiple regression analysis and based on the relationship between porosity, permeability, and pore throat size.
Introduction
Permeability is an important parameter to characterize reservoir and understand fluid behavior in the reservoir. Permeability is obtained from core analysis in the laboratory on plugs or sidewall core. However, coring is only available in limited wells and just some short intervals are selected for one well. As a result, permeability in uncored interval usually predicted base on an empirical model which shows porosity and permeability relationship. Permeability in an uncored interval is calculated by the equation:


Figure 1 - Porosity and Permeability relationship
However, in some case, the relationship between porosity and permeability from core analysis data have a low coefficient of correlation by the heterogeneity of rocks (Figure 1). In the same reservoir, can exits both high and low permeability zone with the same porosity values. That requires accurate alternative methods to predict permeability in an uncored interval.
In this paper, permeability estimation is conducted on sandstone and carbonate rocks by using Hydraulic Flow Unit (HFU), Mercury Injection Capillary Pressure (MICP) and Pittman methods. In addition, we evaluated the permeability prediction methods and selected the most suitable method for each rock type. This will improve the accuracy of permeability prediction in an uncored interval by using core analysis data.
The background of these methods will be reviewed first. The next step is the application of three methods on rock types from Cuu Long and Song Hong basin.
Hydraulic Flow Units Method
Hydraulic Flow Units
A Hydraulic Flow Unit (HFU) is defined as the representative volume of total reservoir rock within which geological properties that control fluid flow are internally consistent and predictably different from properties of other rocks (Ebanks et.all.,1984). Thus:
- An HFU is a reservoir zone that is continuously vertical and horizontal and has similar flow and bedding characteristics.
- In each HFU, the porosity-permeability relationship is close and has distinguished petrophysical properties.
Carman – Kozeny Relation
Assumed that porous medium is a bundle of straight capillary tubes, rock permeability is calculated by combining Darcy's law for flow in porous media and Poiseuille’s law for flow in tubes:
where:

: mean hydraulic radius, μm
: tortuosity
This equation shows that the relationship between permeability and mean hydraulic radius depends on pore characteristic. By comparing porosity, mean hydraulic radius, the surface area per unit grain volume (Sgv), Carman-Kozeny derived the equation to obtained permeability:

where:
: Kozeny constant, which varies from 5 to 100 in real reservoir rocks
Sgv: surface area per unit grain volume,
From the equation (2), we get:

It shows that mean hydraulic radius has a close relationship to petrography parameters change. The relationship between porosity, permeability, and capillary pressure can be obtained from the pore radius, formation factor, cation exchange constant, and saturation exponent. Thus, selected as a factor to predict porosity distribution is reasonable.
Following the equation (3), permeability k is calculated by unit, when converting to md unit should detect conversion factor:

Hydraulic Flow Unit Equation
Amaefule and nnk (1993) derived a method to detect porosity-permeability relationship base on hydraulic flow unit (Figure 2) and definitions about reservoir quality index, flow zone indicator as well as.

Figure 2 - Porosity-Permeability relationship base on flow unit characteristic
Reservoir quality index (RQI):

Flow zone indicator (FZI) depends on geological characteristics of the material and various pore geometry of a rock mass. It is defined follow this equation:

Follow the equation (5), (6), (7), we get:

Where: - pore volume to grain volume ratio
Thus:


Figure 3 - RQI and relationship
HFU Classification
On a log-log plot of RQI versus (Figure 3), all samples with similar FZI values will line on a straight line with unit slope. Samples with significantly different FZI will lie on other parallel lies. Samples that lie on the same straight line trend have similar pore throat characteristics and constitute a hydraulic flow unit. Each line is an HFU and the intercept of this line with =1 is the mean FZI value for that HFU.
The important feature of this method is to identify groups of sample data that form unit-slope straight lines on a log-log plot of RQI versus. The permeability of a particular sample is calculated using the mean FZI value and the suitable sample porosity :
Permeability prediction on sandstone rocks by HFU
Base on routine core analysis data (porosity and permeability) of sandstone rocks from Cuu Long basin, we calculate values of RQI and FZI. Then, the research area is divided into four flow units follow FZI values (Figure 4). Each flow unit has one mean FZI value and same pore characteristics.

Figure 4 - Hydraulic flow unit division on sandstone rocks
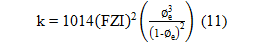
Following the values of mean FZI, permeability is calculated by equation (11).
The porosity- calculated permeability relationships for each hydraulic flow unit are performed on figure 5.

Figure 5 - Porosity-permeability relationship for each hydraulic flow unit of sandstone rocks
The predicted permeability by using hydraulic flow unit is correct compared to core permeability with high correlation coefficient value (Figure 6). It means that HFU is the suitable method for predicting permeability.

Figure 6 - Comparing predicted permeability with core permeability on sandstone rocks
Permeability Prediction on carbonate rocks by HFU
Following the same way on sandstone rocks, the values of RQI and FZI of carbonate samples from Song Hong basin is calculated from porosity and permeability dataset. For carbonate sample data, there are six hydraulic flow units performed in figure 7. The values of mean FZI vary from 0.325 to 10.717 corresponding to six flow units.

Figure 7 - Hydraulic flow unit division on carbonate rocks
Using the equation (11) to calculate the permeability for carbonate dataset. The porosity- predicted permeability relationships for each hydraulic flow units of carbonate rocks are performed on figure 8.

Figure 8 - Porosity-permeability relation for each hydraulic flow unit of carbonate rocks
After calculating, permeability by using HFU method is compared to core permeability (Figure 9). The result shows a good agreement between core permeability and calculated permeability, it means that the hydraulic flow unit is still a suitable method for permeability prediction on carbonate rocks.

Figure 9 - Comparing predicted permeability with core permeability on carbonate using HFU
Mercury Injection Capillary Pressure Method
The principle of mercury porosimetry is the capillary law governing liquid penetration into small pores. Capillary forces in the reservoir are functions of surface and interfacial liquid tensions, pore throat size and shape, and the wetting properties of the rock. Washburn (1921) derived equation demonstrating for this law in the case of a nonwetting liquid like mercury and assuming cylindrical pores:

where Pc - capillary pressure, dynes/cm2
- the interfacial tension of mercury, dynes/cm
θ - contact angle between mercury and the pore surface, degree
rc - radius of pore-throat aperture, μm
This equation states that the pressure required to force a non-wetting liquid to enter a capillary of circular cross-section is inversely proportional to the diameter of the capillary and directly proportional to the surface intension of the liquid and the contact angle with the solid surface. Mercury is used as the non-wetting liquid for intrusion porosimetry because it is non-wetting to most solid materials.
Pore throat size is measured by using Autopore IV equipment (Figure 10), which includes low and high-pressure ports operate independently and up to 60,000 psia. This equipment detects pore diameter ranges from approximately 360 μm to 3.6 μm for low-pressure mode and 6 μm to 0.003 μm for the high-pressure mode.

Figure 10 – Autopore IV equipment
Permeability prediction from MICP
Base on pore throat size data from MICP and porosity, permeability data obtained from routine core analysis, the empirical relationship between permeability, porosity and pore throat size is generated. The samples were grouped into fourteen pore throat size corresponding to mercury saturation of 10%(R10), 15% (R15), 20% (R20), 25% (R25), 30% (R30), 35% (R35), 40% (R40), 45% (R45), 50% (R50), 55% (R55), 60% (R60), 65% (R65), 70% (R70), 75% (R75). The statistical software (Datafit 9.0) is used to conduct multiple regression analysis and generate various empirical relationships. The equation to obtain permeability base on porosity and pore throat size data is:
where :
k - permeability, mD
- porosity, %
a, b, c - the regression variables results
R - pore throat size corresponding to a certain value of mercury saturation, micron
Sandstone
Several empirical relationships were established between permeability, porosity and pore throat size from multiple regression analysis result (Table 1) and the equation have the highest coefficient of correlation (R2=0.9655) at 55% mercury saturation (R55):

Table 1: Empirical equations to determine permeability relating to various mercury saturation for sandstone rocks
That empirical equation (14) is used to calculate permeability on sandstone rocks, and then compare estimated permeability with permeability from core analysis.

Figure 11 - Comparing predicted permeability with core permeability on sandstone rocks
Figure 11 shows the differences between permeability from MICP methods with permeability from core analysis. From this figure, we can see that MICP is not the most suitable method for permeability prediction on sandstone rocks.
Carbonate
Several empirical relationships were established between permeability, porosity and pore throat size from multiple regression analysis results (Table 2) and the equation have the highest coefficient of correlation (R2=0.8498) at 20% mercury saturation (R20):
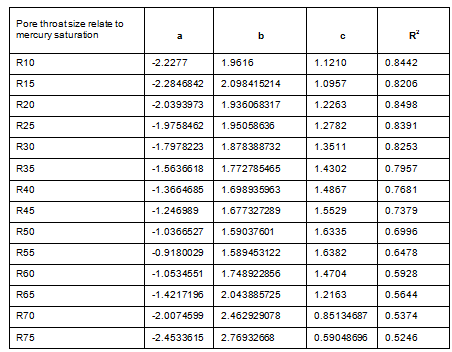
Table 2: Empirical equations to determine permeability relating to various mercury saturation for carbonate rocks
That empirical equation (15) is used to calculate permeability on carbonate rocks, and then compare estimated permeability with permeability from core analysis.


Figure 12 - Comparing predicted permeability with core permeability on carbonate rocks
Figure 12 shows the differences between permeability from MICP methods with permeability from core analysis on carbonate rocks with a high correlation coefficient (R2=0.9674). From this figure, we can see that MICP is a suitable method for permeability prediction on carbonate rocks.
In uncored intervals, porosity can be obtained from well log data, pore throat size can be derived from mercury injection analysis on cutting samples, we can apply the empirical equation to predict permeability.
Pitman’s Equation
Pittman (1992) improved the Windland’s method by defining modal pore aperture. He generated plot of mercury saturation-capillary pressure ratio versus mercury saturation to more accurately define the inflection point, as shown in figure 13.


Figure 13 - A plot of Hg saturation-capillary pressure versus mercury saturation, as a means of determining the apex of Thomeer’s (1960) hyperbole.
Pittman presented empirical relationships among porosity, uncorrected air permeability, and the pore aperture size that corresponds to the displacement pressure and the apex of a hyperbola on a log-log mercury injection plot base on a database of 202 samples of sandstone.
He also suggested that the empirical relationship using the apex variable (Rapex) is slightly less accurate in permeability estimation compared to pore throat size at 25% mercury saturation. Pittman’s equation for permeability prediction follows two empirical relationships:
Log (K) = -0.861+ 1.185 x Log ( + 1.627 x Log (Rapex) (16)
and
Log (K) = -1.221 + 1.415 x Log ( ) + 1.512 x Log(R25) (17)
where
Rapex: pore radius corresponding to the apex, μm
R25 : pore throat radius at 25% mercury saturation, μm
K : uncorrected air permeability, md
: porosity, %
The pore throat radius at 25% mercury saturation obtained from high-pressure mercury injection analysis data, then Pittman’s equation is applied to estimate permeability on sandstone and carbonate rocks.
Sandstone
Figure 14 shows the comparison between predicted permeability by Pittman’s equation and core permeability on sandstone rocks. The result shows that predicted permeability by Pittman’s equation is not matching to core permeability with low correlation coefficient R2=0.4224.
Figure 14: Comparing predicted permeability with core permeability on sandstone by Pittman’s equation
Carbonate
Figure 15 shows the comparison between predicted permeability by Pitman’s equation and core permeability on carbonate rocks. The result shows that predicted permeability by Pittman’s equation is correct compared to core permeability with high correlation coefficient R2=0.9641. This proves that pore throat size is an important parameter for permeability estimation on carbonate rocks.

Figure 15 - Comparing predicted permeability with core permeability of carbonate by Pittman’s equation
Table 3 summarises the coefficient of correlation when comparing estimated permeability and core permeability relate to HFU, MICP, and Pittman methods. As can be seen from the table 3, HFU give the best agreeable between the predicted permeability and core permeability of sandstone rocks. Three methods give good agreement with core permeability on carbonate rocks, however, MICP has the highest correlation coefficient.
Rock Type
Table 3 - The correlation coefficient between estimated permeability and core permeability relate to HFU, MICP and Pittman methods


Conclusion
· Hydraulic Flow Unit is the most accurate method for permeability prediction in the uncored interval on sandstone rocks compared to MICP and Pittman methods. By flow zone division, HFU method shows a good agreement between predicted permeability and core permeability with high correlation coefficient.
· The main feature of HFU method is identifying groups that create straight lines on a log-log plot between of RQI versus. Porosity can be obtained from porosity log, HFU is applied to estimate permeability in the uncored interval. This method is suitable for both sandstone and carbonate rocks.
· The estimated permeability by three methods show good agreement with core permeability on carbonate rocks, but MICP is the most suitable method for permeability estimation with the highest coefficient of correlation.
· The important feature of MICP method is generating empirical relationships between porosity, permeability and pore throat size at various mercury saturation and the equation with the highest correlation coefficient will be selected for permeability prediction. Porosity can be obtained from porosity log, pore throat size can get from mercury injection test on cutting samples, MICP is used to predict permeability. The predicted permeability result shows better agreement with core permeability on carbonate rocks.
· Mercury injection test is sometimes ignored due to cost and sample-destructive issue. For this situation, HFU also is the good selection for permeability prediction on carbonate rocks.
· Pore throat size plays the more important role in permeability prediction on carbonate than sandstone. The relationship between porosity, permeability and pore throat size of carbonate rocks get the highest correlation coefficient at 20% mercury saturation (R20).
· Pittman estimated permeability base on the relationship between porosity, permeability and pore throat size at 25% mercury saturation (R25). This value can be obtained from mercury injection test and Pittman’s equation is applied to predict permeability. Pittman method gives the more accurate result on carbonate rocks.
Acknowledgment
The authors would like to thank the manager of Core & PVT Department (Vietnam Petroleum Institute) for supporting this research.
Nomenclature
References
1. Jude O. Amaufule, Mehmet Altunbay, Diebbar Tiab, David G. Kersey and Dare K. Keelan : “Enhanced Reservoir description: Using Core and Log Data to Indentify Hydraulic (Flow) Units and Predict Permeability in Uncored Intervals/Wells”, paper SPE 26436 presented at the 1993 SPE Annual Technical Conference and Exhibition, Houston, Texas, October 3-6.
2. Odilia Deghirmandjian: ”Identification and characterization of Hydraulic Flow Units in The San Juan Formation, Orocual Field, Venezuela”, Texas A&M University, May 2011.
3. T. Babagagli and S. Al-Salmi: “A Review of Permeability – Prediction Methods for Carbonate Reservoir Using Well-Log Data”, paper SPE 87824 presented at the 2002 SPE Asia Pacific Oil and Gas Conference and Exhibition, Melbourne, Australia, 8-10 October.
4. Tiab, D. and Donaldson, E.C: “Petrophysics, Theory and Practice of Measuring Reservoir Rock and Fluid Transport Properties”, Gulf Publishing Company, 1996.
5. G. V. Chilingarian, S. J. Mazzullo and H. H. Rieke: ”Carbonate Reservoir characterization: A Geologic-Engineering Analysis, Part II”, Developments in Petroleum Science 44.
6. Adolfo D’Windt: “Reservoir Zonation and Permeability Estimation: A Bayesian Approach”, presented at the SPWLA 48th Annual Logging Symposium held in Austin, Texas, United States, June 3-6, 2007.
7. Ceylan Yildirim Akabs :”Determination of Flow Units for Carbonate Reservoirs by Petrophysical – Based Methods”, Middle East Technical University, August 2005.
8. Sidney Diamond: “Pore size distribution in clays”, Purdue University, Lafayette, Indiana 47907.
9. Paul A. Webb: “An Introduction to the physical characterization of material by mercury intrusion porosimetry with emphasis on reduction and presentation of experimental data”, Micromeritics Instrument Corp., Norcoss, Geogria, January 2001.
10. Sami Mo. Aboujafar.: “The Use of High Pressure MICP Data In Reservoir Characterization, Developing A New Model For Libyan Reservoirs”, paper SPE 124425, 2009 SPE/EAGE Reservoir Characterization and Simulation Conference, Abu Dhabi, UAE, 19-21 October 2009.
11. Edward D. Pittman: “Estimating Pore Throat Size in Sandtones from Routine Core Analysis Data”, search and discovery article #40009, 2001.
12. Pittman, E.D. :”Relationship of porosity and permeability to various parameters derived from mercury injection-capillary pressure curves for sandstone”, AAPG Bulletin (1992), 76, 191.
13. Stenphanie Lafage :”An Alternative to the Winland R35 Method for Determining Carbonate Reservoir Quality”, Texas A&M University, August 2008.
14. Swanson, B.F: “A simple correlation between permeabilities and mercury capillary pressure curve”, JPT (1981).
15. I.Jaya, A. Sudaryanto and B. Widarsono: “Permeability Prediction Using Pore Throat and Rock Fabric: A Model From Indonesian Reservoirs”, paper SPE 93363 presented at the 2005 Asia Pacific Oil & Gas Conference and Exhibition, Jakarta, Indonesia, 5-7 April 2005.
16. John Shafer and John Neasham: “Mercury Porosimetry Protocol for Rapid Determination of Petrophysical and Reservoir Quality Properties”, Reservoir Management Group, Poro Technology.
17. A.Al Hinai, R. Rezaee, A. Saeedi and R. Lenormand: “Permeability Prediction from Mercury Injection Capillary Pressure: An Example from the Perth Basin, Western Australia”, APPEA Journal 2013-31.
18. American Society for Testing and Materials (ASTM): ”Standard test method for determination of pore volume and pore volume distribution of soil and rock by mercury intrusion porosimetry”, Vol.04.08 Soil and Rock, Section 4, D4404-84, 579-583.
19. Waddah Al-Hanai, S. Duffy Russell and Badarinadh Vissapragada :” Carbonate Rocks”, scal- 2000.
10. AutoPore IV Automated Mercury Porosimeter Manual, Micrometitics.
This paper published on SPE Reservoir Characterisation and Simulation Conference and Exhibition, 14-16 September, Abu Dhabi, UAE
Link: https://www.onepetro.org/conference-paper/SPE-175650-MS
and Springer International Publishing about Geomechanics and Geophysics for Geo-Energy and Geo-Resources, June 2018
and Springer International Publishing about Geomechanics and Geophysics for Geo-Energy and Geo-Resources, June 2018


Comments
Post a Comment
Many thanks for your comment!